Blog

Cycling Data Pipeline

Cycling is my hobby, and a big part of why it works for me is that it gets me away from a computer screen. I spend my working life in technology industry, so getting outside on a bike for a few hours is the balance to that, and I'm protective of it. What makes these parts of my life interesting is that every ride produces a pile of data. Heart rate, power, cadence, elevation, GPS, plus everything around the ride like sleep and Heart Rate Variability (HRV) and how sore I felt when I woke up.

There's a thing I keep running into professionally, which is that data is the whole game now. Everyone wants to talk about AI models and agents, but the difference between an AI experience that's genuinely useful and one that's a party trick is almost always the data underneath it. Clean, structured, accessible. That's the unglamorous part nobody puts in the demo. So there's a certain irony in the fact that I ended up proving it to myself on my hobby. I have built a data pipeline for my cycling data that captures it using my phone, processes it using two key cycling applications and then allows me to use AI to analyze, query and act on my data.

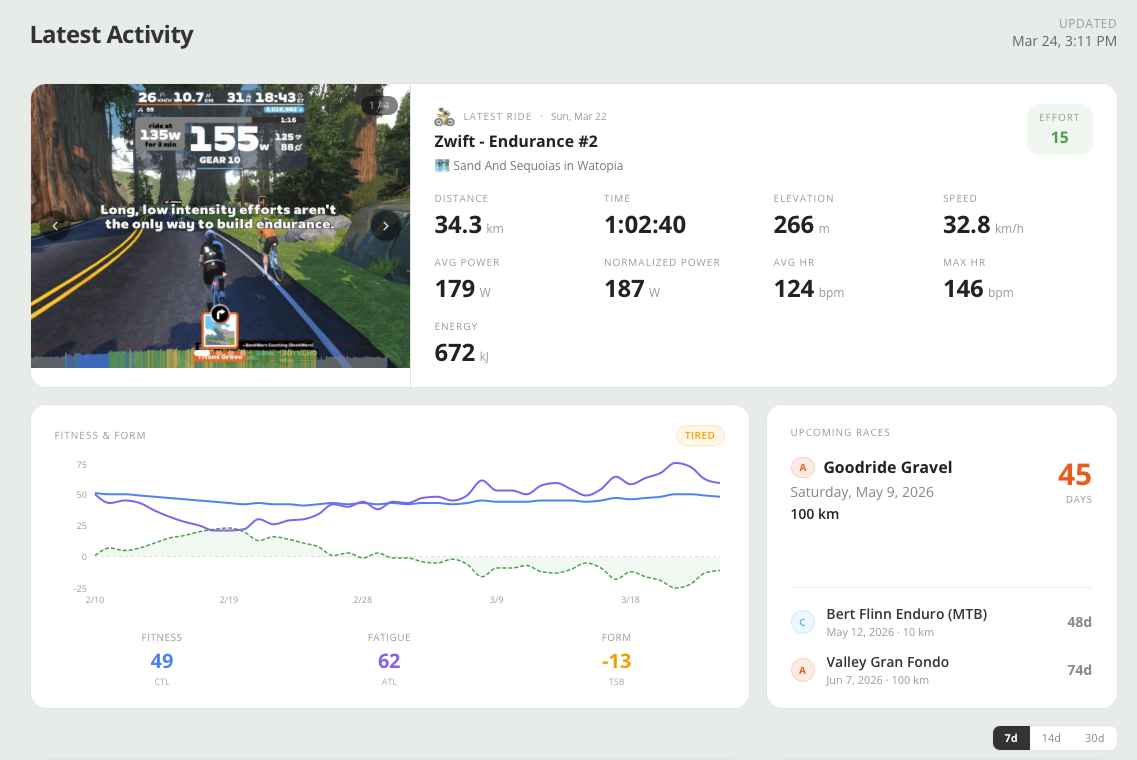
And all of this data powers my activity.dylanhansen.ca site that I blogged about not too long ago!

One Device on the Bars
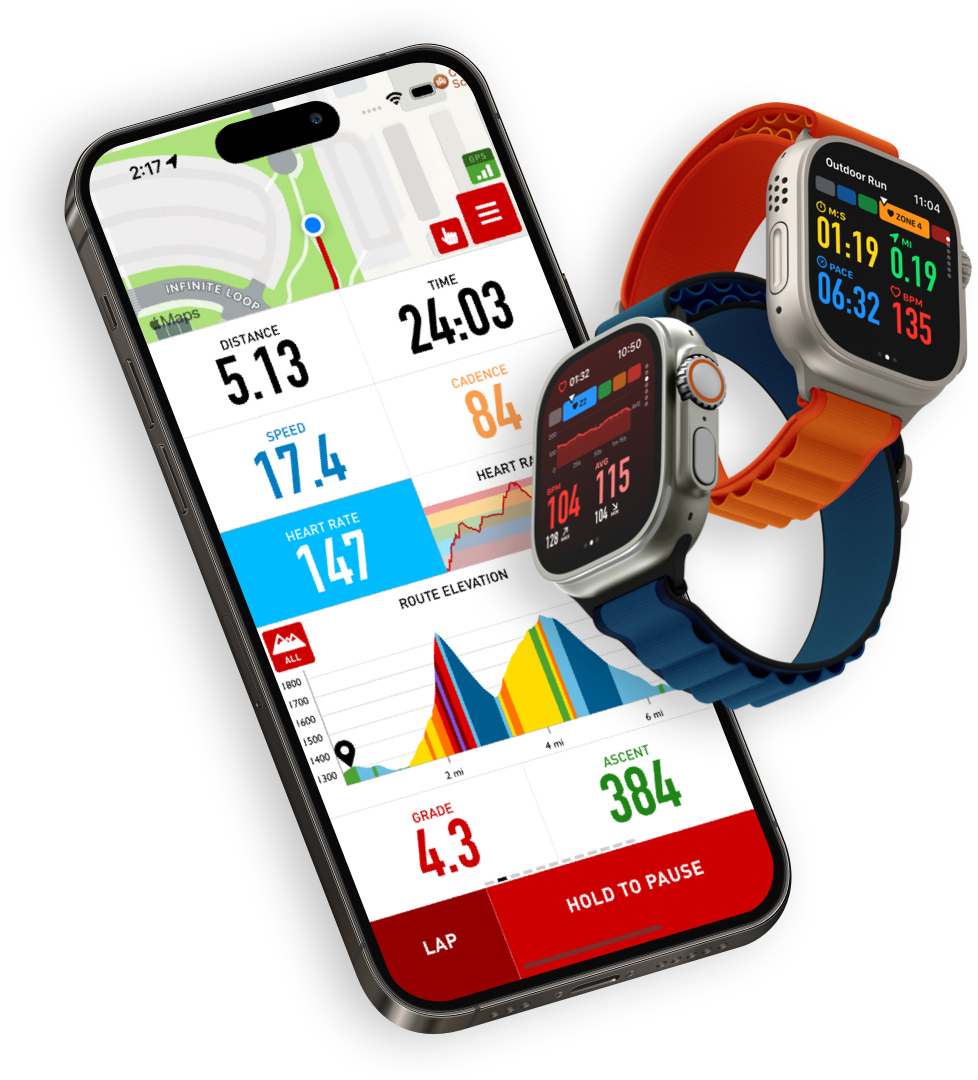
Everything starts with Cadence.app, which is what I use to record rides. It runs on my iPhone, and that's the entire point. I don't want another device to charge, update and sync while my phone sits in my pocket doing nothing. My phone is already the most capable computer I own and it's already coming with me. Cadence just lets me use it as the bike computer too. A few things make that actually work rather than just being a nice idea:

  • It integrates directly with Apple Health. Every ride lands with the rest of my health data instead of in a walled garden I have to export from.

  • The Apple Watch works as a heart rate monitor. No chest strap. I already wear the watch, so that's one less thing to remember, charge and wash.

  • The screens are endlessly configurable, on the fly. I can rearrange what I'm looking at mid-ride depending on whether I'm doing intervals or just spinning. Most head units make you sit down at a computer for that.

For mounting I use a Quad Lock and it's been great. I was skeptical about putting a phone on the bars and I've now done it over some genuinely rough pavement with zero issues. Case on the phone, mount on the stem, quarter turn to connect.

I will note that for MTB I skip the phone and just track with the Apple Watch. It still connects to sensors, so I'm not losing data quality. I just don't get a display or a HUD while I'm riding. Which turns out to be fine. On the road I want the numbers in front of me. On the trail I want to ride the trail and look at the data afterward.

Two Data Destinations In Parallel

From Cadence or Apple Watch, ride data gets pushed to two places at once: Intervals.icu and Strava. People ask why both, and the answer is that they do genuinely different jobs.
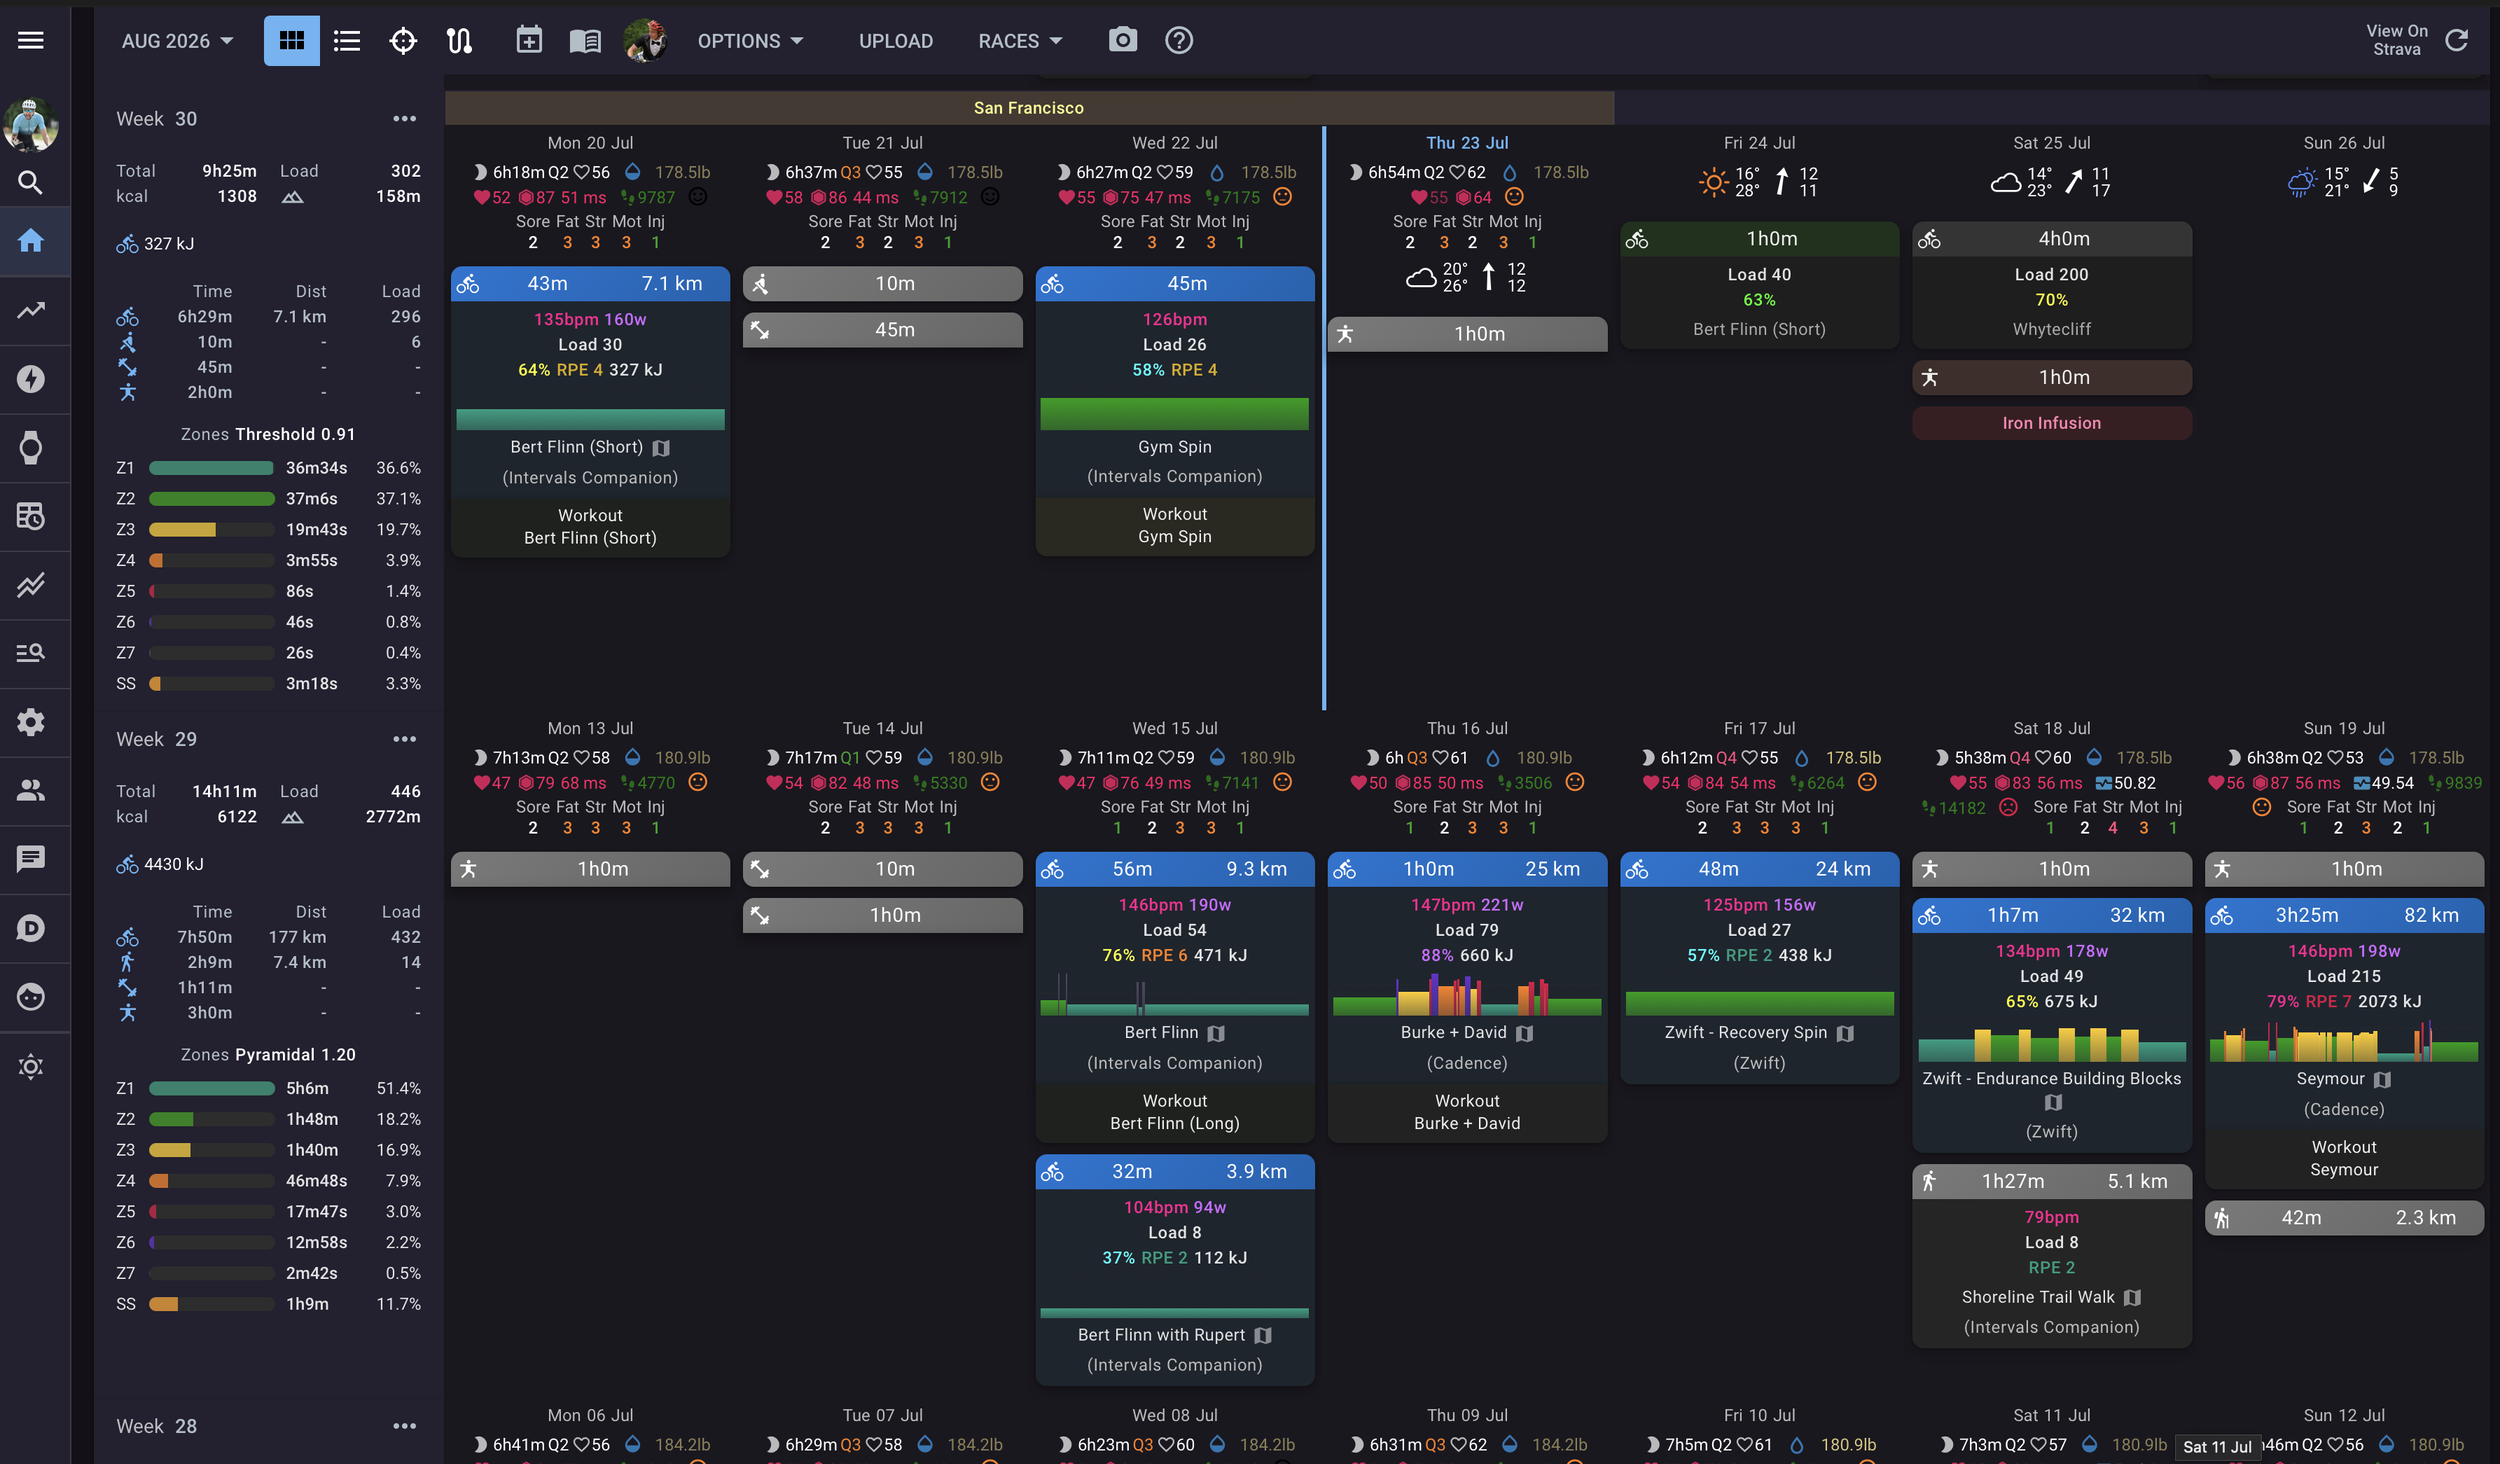
  • Intervals.icu is where I plan and analyze. Structured workouts, the fitness model (CTL, ATL, TSB), HRV, resting HR, sleep, mood, fatigue, soreness. It's where I decide what to do tomorrow and whether yesterday cost me more than I thought. A basic account is free (although it’s worth the $50 CAD / year to upgrade), the developer is remarkably responsive, and the API is wide open.

  • Strava is where I network and where the ecosystem lives. It's where I see what everyone else is riding, track my PRs, and keep a history going back years. It's also the data set that feeds other Strava-specific tools. I use ProBikeGarage to track component wear, which only works because Strava is sitting there as the source of truth for how many hours are on a chain.

Strava tells me what I did and who else was doing it. Intervals tells me what it cost me and what I should do next.

Asking Questions Instead of Reading Charts

Both platforms are now queryable with Claude. For Intervals.icu I built a Skill, essentially a reusable set of instructions that teaches Claude how my data is structured, what my zones and thresholds are, and which endpoints to pull. For Strava I use their MCP connector, which does the same job without me building anything. It’s been great to see Strava launch this MCP connector in the wake of blowback on API changes in the past few years. The result is that I stopped reading dashboards and started asking questions:

  • What's my HRV done since that last big week, and should I be doing intervals tomorrow?

  • Which routes haven't I ridden in six months?

  • Build me a plan for next week that respects a group ride Sunday and legs that are cooked.

Two things came out of that which I didn't expect.

  • The first is honesty about effort and recovery. I used to train on feel, which in practice meant training hard when I felt good and training hard when I felt bad because I felt guilty. Now when my HRV is well below baseline there's a number telling me to back off, and a number is much easier to accept than a vague sense that maybe I'm tired.

  • The second is route variety. I had years of rides sitting in Strava and was cycling through the same handful of routes out of habit. Being able to ask what I haven't ridden lately, and build something new against the terrain and distance I actually want, has made the riding itself more interesting.
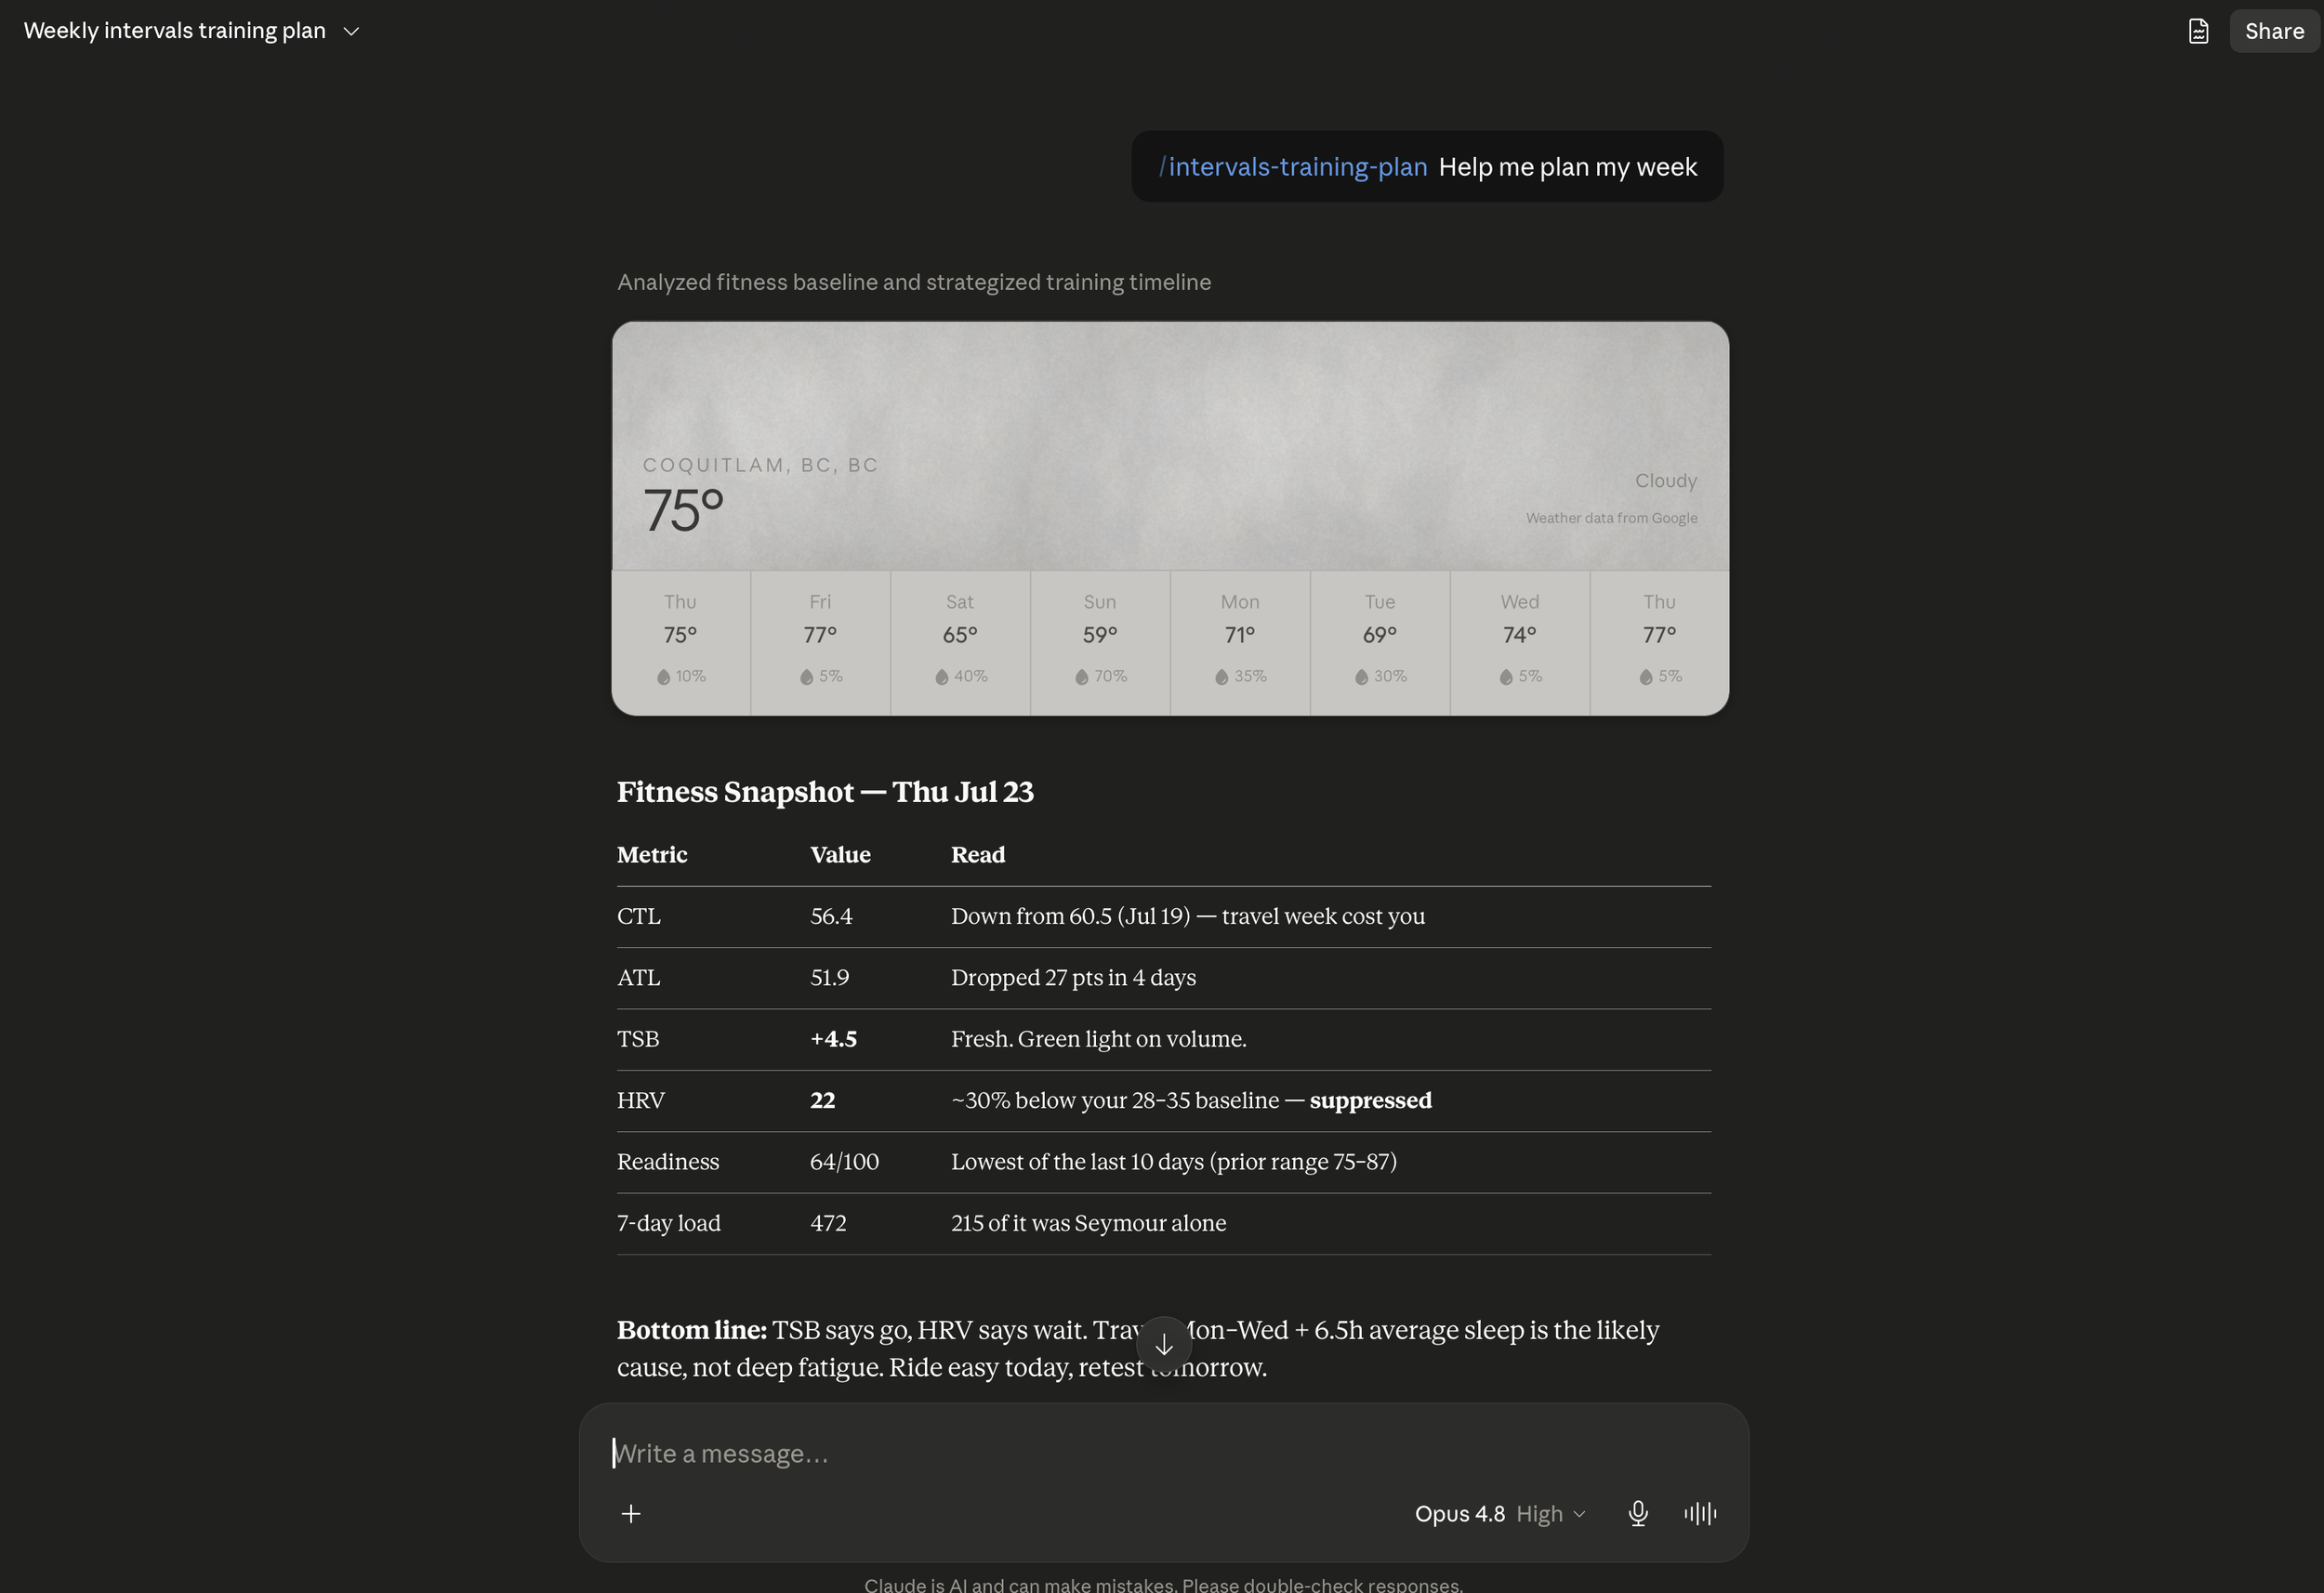
A Saturday in May is the one I point to. I'd had a normal week, my form numbers said I was fresh, and the plan called for a couple of hours on the road on a weekend. My HRV that morning came in at 21, against 48, 54 and 56 the three days before. Resting heart rate was rising. Nothing obviously wrong, I just felt a bit flat, and in any other year I'd have ridden anyway and called it a bad day in the saddle. Instead I did an hour of yoga and nothing else. The next morning HRV was back to 42 and I rode out to Horseshoe Bay (a beautiful ride!), three and a half hours, one of the best rides I've had this year. That ride does not happen if I ride through the Saturday.

What makes that day stick with me is that the two data sources disagreed. My form numbers said go. My recovery numbers said don't. Knowing which one to listen to is the entire value of having both.

What It Adds Up To

None of this made me faster, riding does that. But it changed how I make decisions, and at 42 with a demanding job and two kids, decisions are most of the game. The hard part of training isn't the hard days. It's knowing which days are supposed to be hard.

And none of it works because the AI is clever. It works because the data underneath is clean and the platforms let me at it. Swap any piece for something closed or messy and the whole thing falls over, no matter what model you point at it. Same lesson I run into at work every week, just with better scenery.

I'm sure I'll keep tinkering with it. That does seem to be how all of these go!
Dylan Hansen
Claude Code - Dinner Helper

One of those small annoyances in our house is figuring out where to order from on a Saturday night. We end up rotating through the same few spots by default and half the time we're ordering from somewhere we just went to two weeks ago. I kept thinking there had to be a better way to solve this and it turns out the data I needed was already sitting in a Google Sheet the whole time.

So I built something to solve this! This is my second project using Claude Code as an AI coding partner (the first was my activity dashboard) and I'm really excited to share how it went.

The Idea

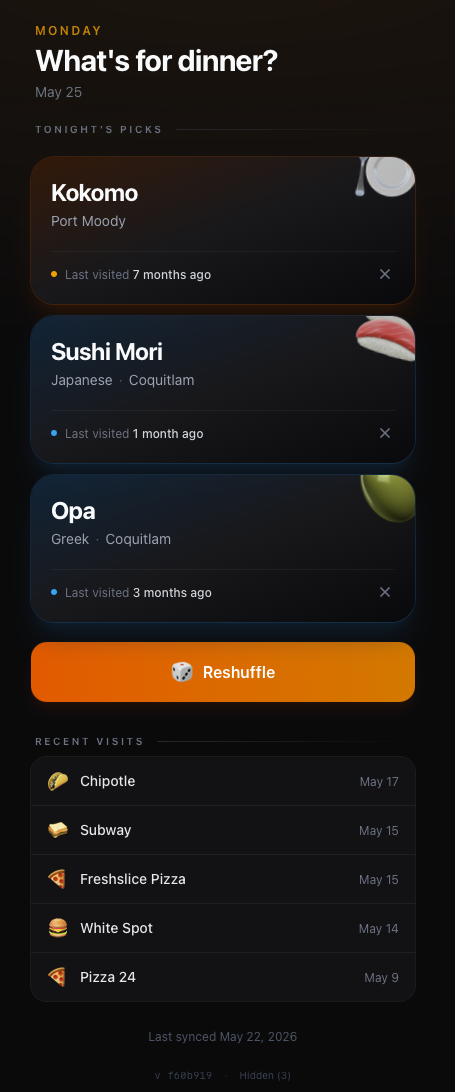
We use Tiller Money to track our finances in a Google Sheet. Every restaurant transaction is already categorized with a date. I wanted to build a simple mobile app that the whole family could use to get a suggestion for where to eat based on how recently and how often we've been to a given place. Places we haven't visited in a while should bubble up, places we just went to should get pushed down.

The result is a private, mobile-first web app. It's shared only with the family and it's been a fun little side project to tinker with.

How Claude Code Fits In

I’m an ex-developer turned AI-curious engineer. I can read code and I understand how things fit together at a high level, but building something end-to-end on my own would have taken me weeks of frustration and half-finished Stack Overflow rabbit holes. Claude Code has genuinely changed that for me.

What I've found is that it's not just about the speed (though that's real). It's about the quality of the learning. When I didn't understand why something was built a certain way, I could just ask and get a real explanation in context. When I pushed back on something feeling overcomplicated, Claude would explain the tradeoffs and we'd find a simpler path. I probably learned more about how Next.js App Router actually works this weekend than I had from months of casual reading.

The whole thing took about 6-7 hours spread across a couple of evenings.

Stack

  • Next.js 15 (App Router) with React 19 and TypeScript

  • Tailwind CSS 4 for styling

  • Upstash Redis for storing restaurant data

  • Claude Haiku for cleaning up merchant names

  • Google Apps Script for syncing the data from Tiller

  • Hosted on Vercel

How It Works

A Google Apps Script runs inside the Tiller Sheet every Saturday. It reads only the merchant name and date from restaurant-categorized rows (no dollar amounts, nothing sensitive) and sends that payload to the app. The app never holds any Google credentials which was an intentional decision Claude helped me think through. Basically if anything ever went wrong on the app side, the worst case is someone sees a list of restaurant names.

When new merchant strings come in that the app hasn't seen before, they get sent to Claude Haiku for cleanup. Tiller merchant names are pretty messy in practice. Things like Ls Woking Dragon, Coquitlam or White Spot #141. Claude strips the city suffix, removes branch numbers, flags venue concession vendors (Rogers Arena food stalls kept showing up under "Restaurants"!), and infers the cuisine type. It also picks an emoji and a color theme for each restaurant card in the UI which was a fun bonus. Results get cached permanently so the same string never needs to be parsed twice.

The Suggestion Logic

The scoring is pretty straightforward: score = 50 - recency_penalty + frequency_bonus

Heavy penalty if you were there in the last two weeks, lighter penalty within a month, and a small bonus for places you visit often because you like them for a reason! Anything you haven't been to in over a year drops off the list entirely. From the scored list the app does a weighted random pick so it doesn't just mechanically serve up the top result every time. Hit "Reshuffle" and you get a fresh draw from the same pool.

What I Actually Got Out of It

Beyond just having a working app, I feel like I came out of this project with a much better understanding of how serverless apps actually fit together. The data pipeline, the Redis caching layer, the scoring logic, the mobile UI with per-cuisine color themes... all of it came together in a way that I can actually explain and reason about now. That's the part I'm most proud of.

I'm looking forward to continuing to tinker with this and keep learning through building real things with Claude Code!

Dylan Hansen
Coding with Claude

I was lucky enough to take a week off work in March over the kid’s spring break. We didn’t really have awesome weather during my week off in Vancouver so we spent quite a bit of time inside. During our movie and chill time I finally got a chance to use Claude Code to solve a real-world problem that I had and it was pretty impressive to see how much AI coding tools and agents have evolved in the past few months.

My goal was to create a publicly visible dashboard of my cycling and health data beyond the systems that I store this information in. I thought this would be cool to share with folks who aren’t on Strava or other fitness apps to get a glimpse of the data I track. The dashboard pulls data from my private Strava account as well as Intervals.icu for which I use to plan my training.

Stack

  • Next.js 16 (App Router) with React 19 and TypeScript 5

  • Tailwind CSS 4 for styling, Recharts 3 for data visualization

  • HLS.js for streaming activity videos, date-fns for date handling

  • Hosted on Vercel with standard Next.js deployment; no database required

Data Sources

The dashboard pulls from two APIs:

  • Strava API (OAuth 2.0 refresh token flow): Recent activities and activity photos/videos

  • intervals.icu API (Basic Auth): Wellness metrics (HRV, resting HR, sleep, mood, stress, fatigue, soreness, hydration), fitness modeling (CTL/ATL/TSB), HR zone data and upcoming race events

Architecture

All data fetching happens server-side in a single page component. API calls to Strava and intervals.icu run in parallel using Promise.allSettled(), so a failure in one source doesn't take down the whole page. Interactive components (charts, carousels, rolling-window toggles) are client components that receive data as props.

Caching is handled through Next.js Incremental Static Regeneration (ISR) with a 1-hour revalidation window so the page is statically generated and refreshed in the background hourly. Strava OAuth tokens are cached in-memory with deduplication to prevent concurrent refresh races.

Look & Feel

I was able to prompt Claude to match the look & feel of my website here and it did a fairly good job of matching the template style and colours on the site. It’s not perfect but it does integrate nicely and also stands alone at activity.dylanhansen.ca.

At the time of writing I have probably put about 4 hours of work into this dashboard which would have taken me weeks in the past. It’s been a fun challenge to learn how to prompt an AI system to build this and also have a simple pipeline for deployment (Claude Code to GitHub to Vercel). I’m looking forward to continuing to tinker with this in my (limited) free time as a way to advance my knowledge of AI coding assistants!

Dylan Hansen